
Investing Basics
Asset Allocation by Age: How to Mix Stocks, Bonds and Cash
How to split your money among stocks, bonds and cash at any age, with rules of thumb, target-date funds, rebalancing steps and worked examples.

“You need to think about the asset allocation that’s going to keep you invested over the long term”
Robert Stammers, then director of investor education at the CFA Institute, to CNBC in 2015
Asset allocation is how you split your investment money among stocks, bonds and cash. That split shapes how much your savings can grow and also how far they can fall in a bad year. The SEC says it “has a major impact on whether you will meet your financial goal.”
Most people only need to get three numbers roughly right: the percent in stocks, the percent in bonds and the percent in cash. Here’s what each piece is there to do.
What each piece does
| Piece | Its main job | Its main risk | Who leans on it most |
|---|---|---|---|
| Stocks (shares of companies, usually through index funds) | Long-term growth that beats inflation | Big drops. In fact, declines of 20% or more have happened many times. | People with 10+ years before they need the money |
| Bonds (loans to governments and companies, usually through bond funds) | Steadier income and a cushion when stocks fall | Losses when interest rates jump, and slow growth | People within about 10 years of spending the money |
| Cash (savings, money market funds, short Treasury bills) | Money you can’t afford to lose, ready to spend | Inflation slowly shrinks what it buys | Emergency funds and goals less than 3 years away |
A quick answer if you want one: money you need in under three years belongs mostly in cash. Money you won’t touch for 15 years or more can be mostly in stocks, as long as you can sit through the drops without selling. Everything in between is a mix, and the rest of this guide shows you how to pick your asset allocation.
In this guide
- What asset allocation means, in plain English
- Stocks, bonds and cash: what history shows
- The three questions that set your mix
- Asset allocation by age: rules of thumb and their limits
- Target-date funds: the one-fund shortcut
- Count every account as one portfolio
- Rebalancing: keeping your mix on target
- The biggest risk is usually behavior
- Five myths, checked against the facts
- Mistakes that quietly wreck a good mix
- Your seven-step allocation plan
- What to remember
- Questions readers ask
What asset allocation means, in plain English
The SEC’s investor education site, Investor.gov, defines asset allocation as “dividing an investment portfolio among different asset categories,” such as stocks, bonds and cash. A portfolio is just the full set of investments you own, across all your accounts.
That matters because each asset class (a group of investments that behave in similar ways) tends to rise and fall at different times. When stocks crash, high-quality bonds often hold up better. When inflation runs hot, cash and bonds can lose buying power while stocks catch up over time. Owning more than one gives you a smoother ride. In the SEC’s words, “By investing in more than one asset category, you’ll reduce the risk that you’ll lose money” (Investor.gov).
Most American families are already making this choice, whether they know it or not. In 2025, 56% of families owned stocks directly or through funds and retirement accounts, according to the Federal Reserve’s Survey of Consumer Finances.
Asset allocation vs. diversification
People mix these up, but they’re two different layers.
- Asset allocation is the split between asset classes. Example: 70% stocks, 25% bonds, 5% cash.
- Diversification is spreading money within each class. Example: owning thousands of companies through a total market index fund instead of five stocks you like.
FINRA, the self-regulatory organization that oversees brokerage firms under SEC supervision, puts it this way: diversification is “the spreading of your investments both among and within different asset classes” (FINRA). You need both. A 70/30 mix doesn’t protect you much if the “70” is one company’s stock.
So the easiest building blocks are broad, low-cost index funds. If you’re new to them, our guide to how index funds work covers the basics. For example, one fund can hold thousands of stocks or bonds, which handles diversification for you. Then your only real job is the allocation.
Why your asset allocation matters so much
Your asset allocation sets your range of outcomes. For example, a portfolio that’s 100% stocks can grow faster over decades. It can also lose a large share of its value in a single bad year, and take years to recover. A portfolio that’s mostly bonds and cash rarely drops much, but it grows slowly and may not keep up with rising prices.
Neither one is “right.” The SEC says plainly that “There is no single asset allocation model that is right for every financial goal.” The right mix is the one that fits when you need the money and how you’ll behave when markets get scary.
This short video from Fidelity also walks through the same idea with simple visuals: stocks, bonds and cash, and how the mix changes your ride.
Glossary: six asset allocation words you’ll see
- Allocation: the percent of your money in each asset class.
- Time horizon: how long until you need to spend the money.
- Risk tolerance: how much of a drop you can stomach without panicking.
- Volatility: how much and how often prices swing up and down.
- Rebalancing: buying and selling to bring your mix back to its target.
- Glide path: the schedule a target-date fund follows as it shifts from stocks to bonds.
Stocks, bonds and cash: what history shows
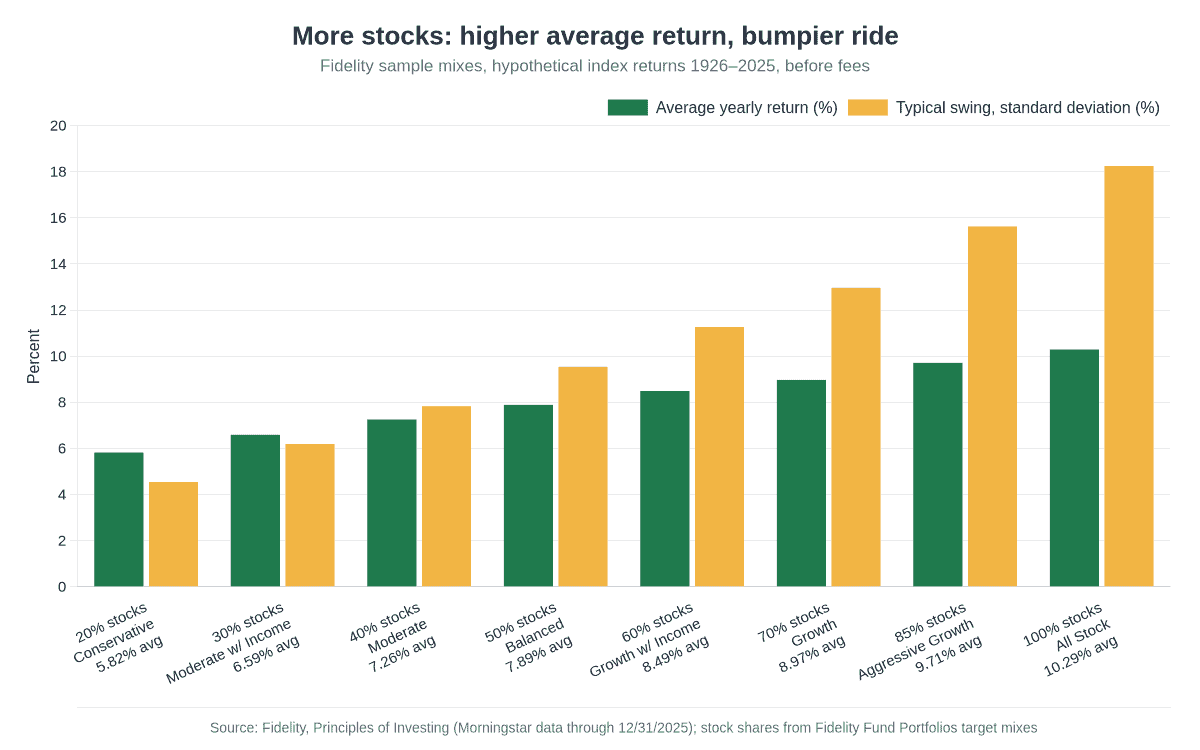
The clearest way to see the trade-off is to look at long stretches of history. For example, Fidelity tracked eight sample mixes from 1926 through 2025, using Morningstar data. The results line up almost like stairs.
| Fidelity sample mix | Stocks | Average yearly return, 1926–2025 | Typical swing (standard deviation) |
|---|---|---|---|
| Conservative | 20% | 5.82% | 4.55% |
| Moderate with Income | 30% | 6.59% | 6.19% |
| Moderate | 40% | 7.26% | 7.83% |
| Balanced | 50% | 7.89% | 9.54% |
| Growth with Income | 60% | 8.49% | 11.27% |
| Growth | 70% | 8.97% | 12.97% |
| Aggressive Growth | 85% | 9.71% | 15.62% |
| All Stock | 100% | 10.29% | 18.25% |
Returns and swings come from Fidelity’s Principles of Investing page. The stock shares are Fidelity’s target mixes for portfolios with the same names on its Fund Portfolios page, where the 100% stock mix is called “Most Aggressive.” These are hypothetical index results before fees, and past results don’t promise future ones.
Standard deviation is a measure of how bumpy the ride was. So a bigger number means bigger swings, up and down. Notice the pattern. For instance, moving from 20% stocks to 100% stocks added about 4.5 percentage points of average yearly return. It also made the typical swing about four times larger.
Stocks: the growth engine
Stocks are small slices of ownership in companies. Over long periods they’ve grown faster than anything else on this list, which is why every long-term mix holds some. But the price of that growth is volatility. Stocks can fall hard and then stay down for years.
Most people also split their stock money between U.S. and international funds. Vanguard’s target-date funds, for example, hold roughly 60% of their stock money in a U.S. fund and 40% in an international fund, based on the holdings in the funds’ annual report filed with the SEC.
Bonds: the shock absorber
A bond is a loan. You lend money to the U.S. government, a city or a company, and then they pay you interest. Bond funds hold hundreds or thousands of these loans.
Bonds usually swing far less than stocks, and high-quality bonds have often held up when stocks crashed. But they aren’t risk-free. When interest rates rise quickly, existing bonds lose value. That’s what happened in 2022, when the U.S. stock market fell 19.4% and the broad U.S. bond market fell 12.9%, its worst year in modern history, according to Morningstar.
The upside today is that bonds pay more than they did a few years ago. On October 23, 2026, the 10-year U.S. Treasury note yielded 5.00% and the 2-year yielded 4.69%, according to the Treasury’s daily yield curve. A yield is roughly the yearly interest rate you’d earn by buying and holding that bond.
Cash: the safety net
“Cash” in investing means savings accounts, money market funds, CDs and very short Treasury bills. The SEC notes the chance of losing money here is “generally extremely low.” But the danger is quieter: “The principal concern for investors investing in cash equivalents is inflation risk.”
Right now cash pays decently. For example, the 3-month Treasury bill yielded 4.22% on October 23, 2026. Prices rose 3.7% over the 12 months ending September 2026, according to the Bureau of Labor Statistics. So a good cash yield is barely staying ahead of inflation, and that’s before taxes on the interest.
Watch out: FDIC insurance covers bank deposits up to $250,000 per depositor, per insured bank, for each account ownership category. It does not cover stocks, bonds, mutual funds, annuities, Treasury securities or crypto, even if you bought them at a bank (FDIC). And money in a money market fund “is not guaranteed by the FDIC like bank accounts are” (Investor.gov).
Where does your emergency fund fit? Keep it outside your investment mix, in an insured savings account. It’s not there to grow. It’s there so you never have to sell stocks in a bad month to pay for a car repair. Our emergency fund guide helps you size it.
The three questions that set your mix
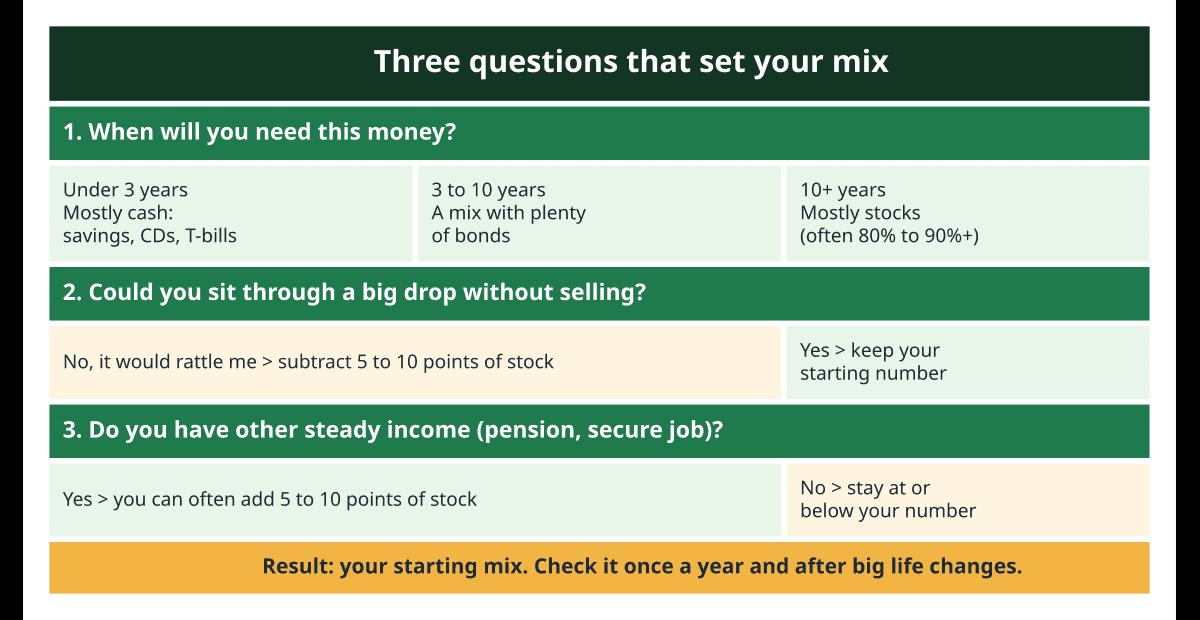
Age gets most of the attention, but it’s really a stand-in for something else. Instead, your asset allocation should come from three questions. Answer them honestly and the numbers mostly pick themselves.
1. When will you need this money?
This is your time horizon. Investor.gov describes it as “the expected number of months, years, or decades you will be investing” toward a goal. It’s the single biggest factor.
Stocks need time to recover from drops. For example, money for a goal 25 years away has time to wait out several bad markets. But money for a house down payment due next spring does not. Schwab’s sample mixes follow this logic closely (Schwab Center for Financial Research, May 2026):
| Schwab sample investor | Time horizon | Stocks | Bonds | Cash |
|---|---|---|---|---|
| Aggressive | 15+ years | 95% | 0% | 5% |
| Moderate | Around 10 years | 60% | 35% | 5% |
| Conservative | 3 to 5 years | 20% | 50% | 30% |
One person can also have several horizons at once. For example, your retirement money might be 30 years out, your kid’s college fund 10 years out and your next car fund 2 years out. Each goal can get its own mix.
2. How much of a drop can you sit through?
This is your risk tolerance. The SEC defines it as “your ability and willingness to lose some or all of your original investment in exchange for greater potential returns.”
Notice the two parts. Willingness is emotional. Would a 25% drop make you lose sleep, or would you shrug? Ability is practical. If you lost your job during that drop, would you have to sell? People with steady jobs, solid emergency funds and pensions usually have more ability to take risk than people with shaky income.
A simple test: imagine your account balance is $100,000 and you open it one morning to see $70,000. Would you hold, buy more or sell? If the honest answer is “sell,” your mix holds more stock than you can handle. That’s fine to know now. It’s expensive to learn in a crash.
3. What else do you have to lean on?
A pension, Social Security, rental income or a spouse’s steady paycheck all act a bit like bonds. After all, they pay you no matter what the stock market does. Someone with a good pension can often afford more stocks in their 401(k) than someone whose 401(k) is their only retirement money.
On the other hand, some people can’t afford to play too safe. Retirement may last 30 years, and prices keep rising the whole time.
“If you significantly overweight fixed income, it will be difficult for your portfolio to preserve your buying power.”
Joe Pitzl, certified financial planner and partner at Pitzl Financial, to CNBC in 2015
“Fixed income” is another name for bonds. His point: even near or in retirement, most people still need some stocks so their money keeps up with rising prices.
Worked example: one person, two asset allocations
Kwame is a 29-year-old graphic designer (a hypothetical example). He has $30,000 saved for a home down payment he plans to make in three years. So let’s test two mixes against a rough year. We’ll assume stocks fall 35%, bonds gain 2% and cash earns 4%. Of course, these numbers are made up to show the math, not a forecast.
| Mix for the $30,000 | Stocks | Bonds | Cash | Balance after the bad year | Change |
|---|---|---|---|---|---|
| All stocks | $30,000 | $0 | $0 | $19,500 | −$10,500 |
| Conservative (20/50/30) | $6,000 | $15,000 | $9,000 | $28,560 | −$1,440 |
The math for the conservative mix: $6,000 × 0.65 = $3,900 in stocks, $15,000 × 1.02 = $15,300 in bonds and $9,000 × 1.04 = $9,360 in cash. That totals $28,560.
With all stocks, Kwame’s down payment shrinks by a third right when he needs it. With the conservative mix, he loses a little and can still buy on time. In fact, for money due in under two years, many people skip stocks entirely and use high-yield savings, CDs or Treasury bills. Our guide on saving for a down payment covers those options.
But Kwame’s retirement money is a different story. He won’t touch it for over 30 years, so a mostly-stock mix there makes sense. Same person, same day, two very different allocations. That’s normal.

Asset allocation by age: rules of thumb and their limits
Because age roughly tracks time horizon for retirement money, people use quick formulas to turn their age into a stock percentage. You’ve probably seen one of these.
- 100 minus your age: a 30-year-old holds 70% stocks.
- 110 minus your age: the same 30-year-old holds 80% stocks.
- 120 minus your age: the same 30-year-old holds 90% stocks.
Kiplinger notes a common complaint about the original 100 rule: it’s outdated, given longer life expectancies and later retirements. Instead, it suggests the 110 rule could be a better middle ground. NerdWallet also mentions subtracting your age from 100 or 110 as common rules of thumb. Here’s what each rule gives at different ages, next to what Vanguard’s target-date funds actually do.
| Age | 100 − age | 110 − age | 120 − age | Vanguard target-date design |
|---|---|---|---|---|
| 25 | 75% | 85% | 95% | 90% stocks |
| 35 | 65% | 75% | 85% | About 90% (cuts start around 40) |
| 45 | 55% | 65% | 75% | Gradually falling |
| 55 | 45% | 55% | 65% | Gradually falling |
| 65 | 35% | 45% | 55% | 50% stocks |
| 72 | 28% | 38% | 48% | 30% stocks (final mix) |
How Vanguard’s asset allocation compares
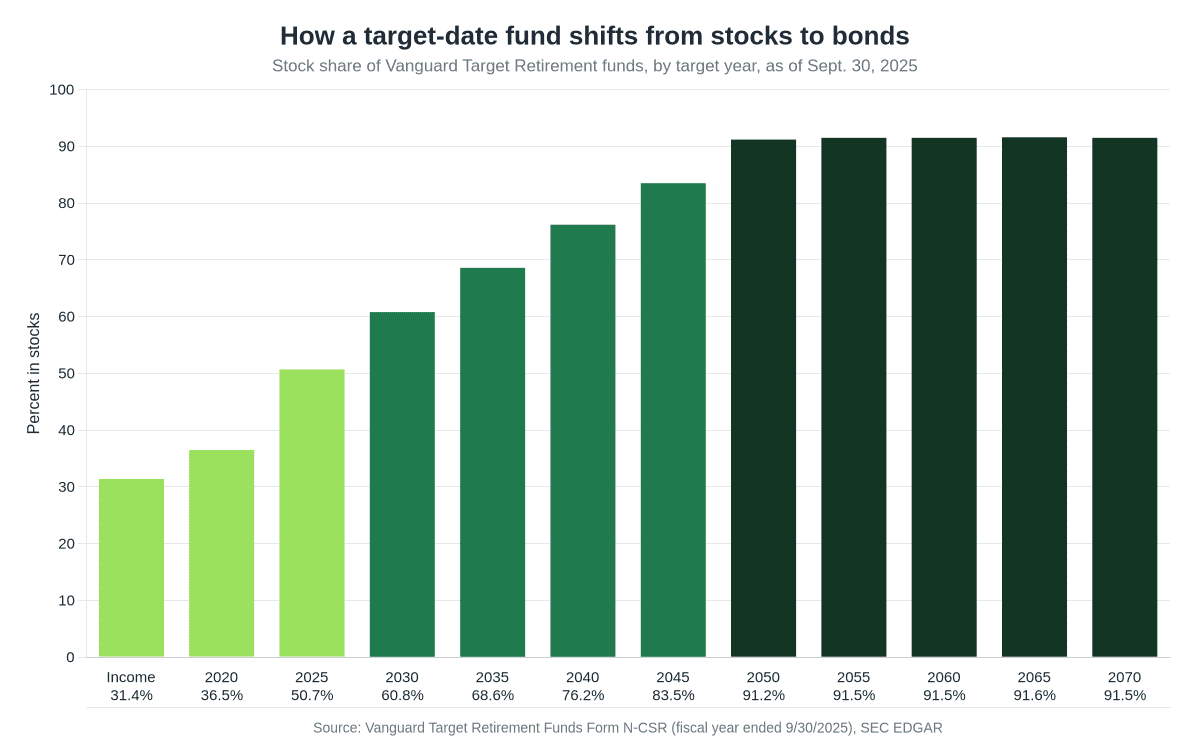
The Vanguard column comes from its Target Retirement series specifications. Its funds hold 90% stocks at age 25 and 50% at the target retirement age of 65. They then reach a final 30% stock mix seven years after the target date. Vanguard’s glide path page also says it starts gradually reducing stock exposure around age 40.
Look at the gaps. At 25, the 100 rule says 75% stocks while Vanguard holds 90%. At 65, the 100 rule says 35% while Vanguard holds 50%. Vanguard’s design is more stock-heavy than the old rule at every age. Kiplinger notes that longer life expectancies and later retirements have led some experts to use a number higher than 100.
Worked example: three rules, one retiree-to-be
Gloria is a 61-year-old school librarian who plans to retire at 65 (hypothetical). Here’s what each rule says for her:
- 100 − 61 = 39% stocks
- 110 − 61 = 49% stocks
- 120 − 61 = 59% stocks
A target-date fund built for her retirement year, Vanguard’s Target Retirement 2030 fund, held about 61% stocks on September 30, 2025, according to its SEC filing. So the range of “reasonable” answers for Gloria runs from about 40% to about 60%. That’s a 20-point spread.
How does she pick? With the three questions. For one thing, Gloria will get a teacher’s pension that covers most of her basic bills. That steady income works like a big bond holding, so she can lean toward the higher end. If she had no pension and needed her savings to pay rent from day one, the lower end would fit better.

What age-based asset allocation rules miss
Kiplinger lists the main drawbacks of age rules: they’re one-size-fits-all, they ignore your goals and risk tolerance, and they’re built around retirement rather than goals like buying a house. Schwab’s view is similar: age “is a good starting point, providing you with a rough time frame,” but your needs, risk tolerance and goals matter too. A starting point, not the answer.
Not everyone agrees on bonds at all. Ramsey Solutions suggests spreading retirement money evenly, 25% each, across four types of stock mutual funds: growth and income, growth, aggressive growth and international. It calls bonds “so-called safe investments” that barely keep up with inflation (Ramsey Solutions). That’s an all-stock approach, so it differs sharply from Vanguard, Schwab and Fidelity, which all add bonds as you get closer to spending the money. If you go all-stock, be sure you can live through a deep drop without selling, especially in the years right before and after you retire.
Pro tip: Pick the rule that matches your gut, then adjust five or ten points for your situation. Add stock if you have a pension, a very secure job or a long time to go. Cut stock if your income is shaky, you’ll retire soon or past drops made you want to sell.
Target-date funds: the one-fund shortcut
A target-date fund is a single fund that holds stocks, bonds and sometimes cash, then slowly shifts toward bonds as a chosen year gets closer. You pick the fund with the year closest to when you’ll retire, such as “2060,” and it handles the mix for you.
The SEC’s description of these “lifecycle” funds is simple: “The managers of the fund then make all decisions about asset allocation, diversification, and rebalancing.” Vanguard’s funds, for example, rebalance daily as needed.
They’ve also become the default in workplace plans. According to Vanguard’s How America Saves 2026 report, which covers the plans Vanguard runs, in 2025:
- 84% of participants used target-date funds when their plan offered them.
- 73% of target-date investors had their entire account in a single target-date fund.
- Only 2% of participants held no stocks at all in 2025.
“The genius of target-date funds is that they harness that natural tendency toward inertia but they do so for the good.”
Christine Benz, then Morningstar’s director of personal finance, in Morningstar (2021)
In other words, most people don’t adjust their investments often. A target-date fund turns that habit into a feature, because the fund adjusts for you.
What to check before you choose one
The SEC’s investor bulletin on target-date funds lists the key things to check:
- They aren’t guaranteed. In fact, the SEC says these funds do not guarantee “that you will have sufficient retirement income” at or after the target date. They can lose money, including near the target year.
- “To” or “through.” A “to” fund stops shifting at the target date. But a “through” fund keeps getting more conservative for years after. Vanguard’s funds, for example, keep shifting for seven years after the target date.
- The mix at the target date. For example, two “2035” funds from different companies can hold very different amounts of stock. Look up the actual percentages.
- Fees. The SEC notes, “Even small fees can have a large impact on your investment over time.” Vanguard’s target-date series, for example, lists an asset-weighted expense ratio of 0.07% a year as of December 31, 2025. Target-date fees vary widely from company to company, so compare.
Watch out: A target-date fund is built to be your whole mix. If you hold one and then add a separate stock fund “for growth,” you’re changing the allocation the fund was designed to manage. That’s fine if you mean to. Just do the math first, as in the next section.
Our guide to how a 401(k) works explains how to find and change the funds in your workplace plan.

Count every account as one portfolio
Most people own investments in more than one place: a 401(k) at work, an IRA, maybe an old 401(k) from a past job and a brokerage account. Your true asset allocation is the mix across all of them. Looking at each account on its own can hide a mix that’s much riskier, or much safer, than you think.
Worked example: Owen’s real stock share
Owen is a 34-year-old electrician (hypothetical). He believes he’s “in a target-date fund, so I’m balanced.” Here’s what he owns:
| Account | Balance | What it holds | Stock share (assumed) | Dollars in stocks |
|---|---|---|---|---|
| 401(k) | $62,000 | Target 2055 fund | About 90% | $55,800 |
| Roth IRA | $14,000 | Total stock market index fund | 100% | $14,000 |
| Total invested | $76,000 | $69,800 |
His real stock share is $69,800 ÷ $76,000 = about 92%. His $9,000 emergency fund sits in a savings account and isn’t counted, since it isn’t invested.
Is 92% wrong for a 34-year-old? Not necessarily. In fact, it’s close to what many target-date funds hold at his age. Still, the point is that Owen should know his number. If he’d rather be at 80%, he could put new Roth IRA money into a bond index fund until the total mix gets there.
How to add up your total asset allocation
- List every investment account and its balance.
- For each fund, look up its stock, bond and cash percentages. Fund fact sheets list this, often under “asset allocation” or “portfolio composition.”
- Then multiply each balance by its stock percentage to get the dollars in stocks. Do the same for bonds and cash.
- Finally, add the dollars across accounts and divide by your total. That’s your real mix.
Many brokerages show a combined mix if you link your outside accounts. But a spreadsheet with four columns works just as well.
Where to hold what: asset location vs. asset allocation
Once you think of your accounts as one portfolio, you can also think about which account holds which piece. This is called asset location. That matters because trades inside IRAs and 401(k)s don’t create a tax bill each year. The IRS explains that “IRAs let earnings grow tax deferred. Individuals pay taxes on investment gains only when they make withdrawals,” and qualified Roth withdrawals are tax-free (IRS). As a result, retirement accounts are the easiest place to rebalance. Still, for most beginners, the key step is simply to know the total. Fine-tuning location can wait. Our Roth vs. traditional IRA guide explains how those two accounts are taxed.
Rebalancing: keeping your asset allocation on target
Here’s the catch with any asset allocation: it doesn’t stay put. When stocks have a great run, they grow into a bigger slice of your portfolio. Your 60/40 quietly becomes 70/30, and you’re taking more risk than you chose.
Fidelity shows how far this can go. In a hypothetical portfolio that wasn’t maintained, a mix that started in December 2015 at 42% U.S. stocks, 18% international stocks, 35% bonds and 5% short-term investments had drifted by December 2025 to 63% U.S. stocks, 17% international, 17% bonds and 3% short-term (Fidelity). Total stocks went from 60% to 80%. Meanwhile, bonds were cut in half, without the owner doing a thing.
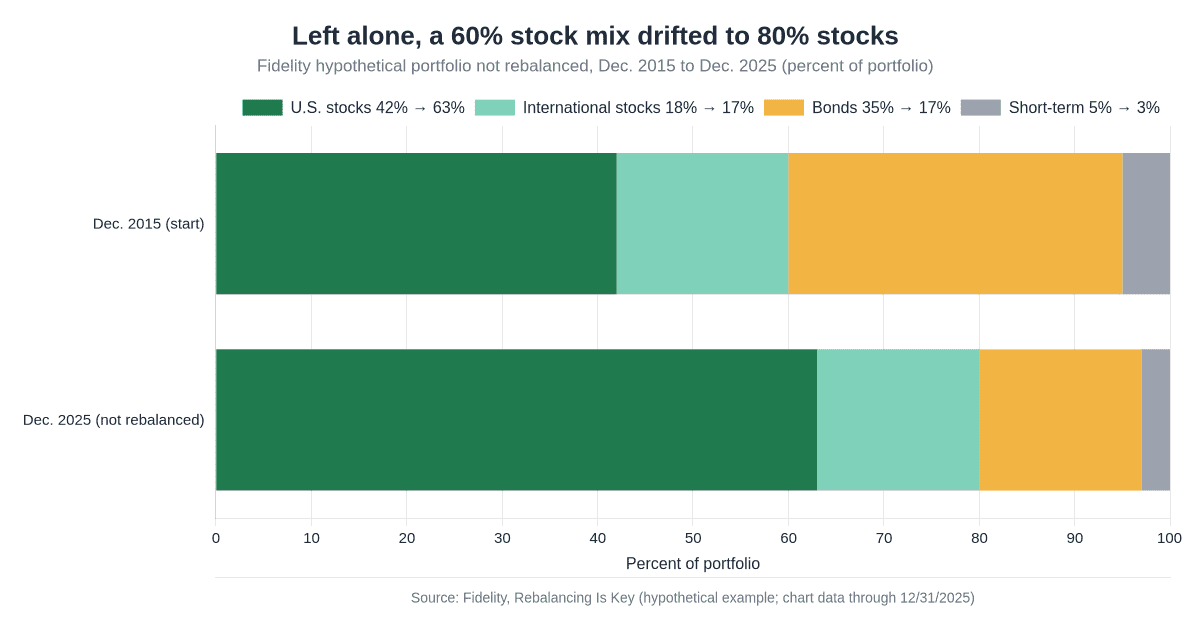
Rebalancing means selling some of what grew and buying more of what lagged, to get back to your target. It feels backward, because you’re trimming your winners. That’s the point. In other words, you’re locking in some gains and keeping your risk where you set it.
“But rebalancing is a way to minimize risk, not necessarily to maximize returns.”
Maria Buono, then head of the US wealth planning research team at Vanguard, to Yahoo Finance
Two ways to decide when
The SEC describes two common approaches:
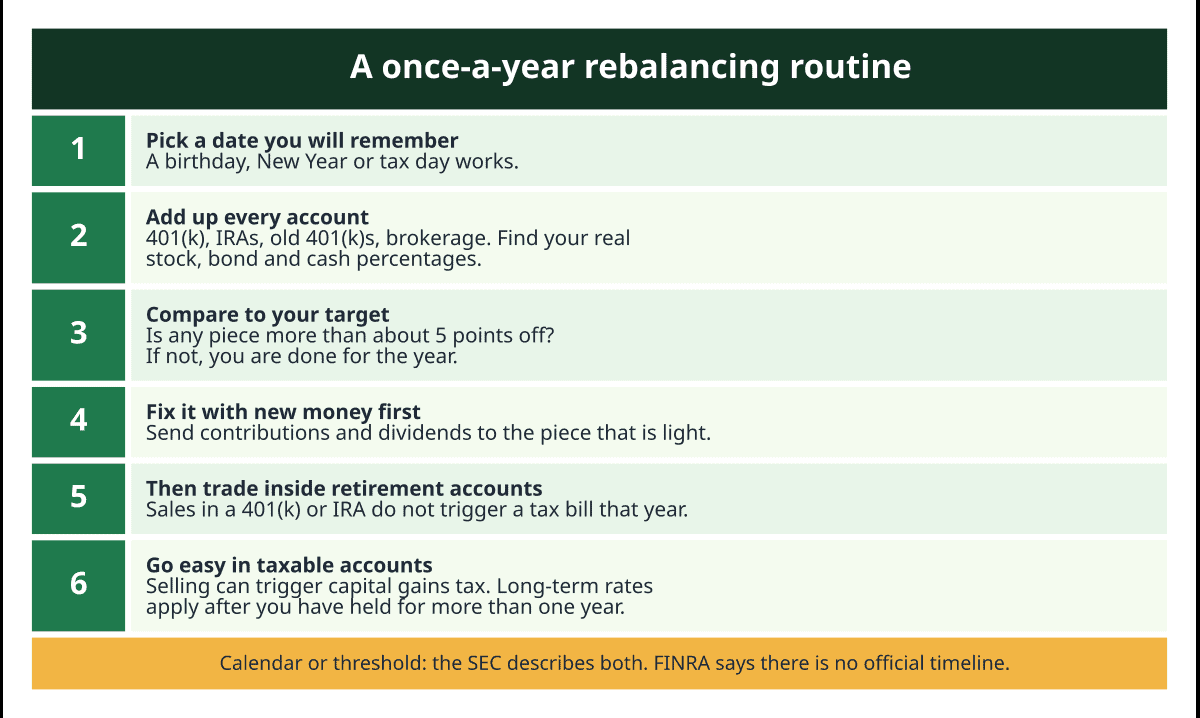
- Calendar rebalancing: check and fix your mix on a schedule, “such as every six or twelve months.” For example, many people pick a date they’ll remember, like a birthday or tax day.
- Threshold rebalancing: rebalance “only when the relative weight of an asset class increases or decreases more than a certain percentage.” A common personal rule of thumb is a band of about 5 percentage points, but there’s no official number.
FINRA agrees “there’s no official timeline” and suggests you consider whether you need to rebalance about once a year. Meanwhile, Schwab Intelligent Portfolios, Schwab’s automated service, monitors portfolios daily. It trades only when an asset class drifts far enough from its target, which Schwab says “typically results in a couple of rebalancing events per year” (Schwab). A simple and sensible combo for most people: look once a year, and act only if something has drifted more than about 5 points.
Worked example: one year of drift
Lena and Sam are both 52 (hypothetical). She’s a nurse, and he’s a bus mechanic. They have $120,000 in their IRAs, set at 60% stocks and 40% bonds. That is $72,000 in a stock index fund and $48,000 in a bond index fund. Then comes a strong year: assume stocks gain 28% and bonds gain 2%.
| Start of year | End of year | Target (60/40 of new total) | Trade | |
|---|---|---|---|---|
| Stocks | $72,000 (60%) | $92,160 (65.3%) | $84,672 | Sell $7,488 |
| Bonds | $48,000 (40%) | $48,960 (34.7%) | $56,448 | Buy $7,488 |
| Total | $120,000 | $141,120 | $141,120 |
As a result, their stock share drifted 5.3 points, just past a 5-point band. So they sell $7,488 of the stock fund and buy $7,488 of the bond fund. They make the trades inside each of their own IRAs, since spouses can’t move money between their two IRAs. Because it’s all inside IRAs, the trades create no tax bill that year.
Ways to rebalance without selling
- Point new money at the laggard. If bonds are low, send your next few months of contributions to the bond fund. Schwab’s automated service works the same way with sale proceeds, buying the most underweight piece first.
- Redirect dividends and interest. Instead of reinvesting each fund’s payouts in itself, have them paid out and invest them where you’re light.
- Withdraw from the winner. During retirement, take your spending money from whatever has grown the most.
Mind the taxes in regular brokerage accounts
Selling in a regular taxable account, though, can trigger capital gains tax, which FINRA flags as a cost of rebalancing. The IRS treats an investment held “for more than one year” as long-term, which usually gets lower rates. But gains on investments held one year or less are short-term and taxed like regular income (IRS Topic 409).
For tax year 2026 (the return you’ll file in 2027), the 0% long-term capital gains rate covers taxable income up to $49,450 for single filers. For married couples filing jointly, it’s $98,900. Then the 15% rate runs up to $545,500 for single filers and $613,700 for joint filers, and 20% applies above that (IRS Rev. Proc. 2025-32). So rebalancing inside your 401(k) or IRA first, and with new money in taxable accounts, avoids most of this.
The biggest risk is usually behavior
A sensible mix only works if you keep it. In fact, the most common way people damage their returns isn’t picking the “wrong” allocation. It’s changing it at the wrong time: buying more after prices have climbed and selling after they’ve fallen.
Morningstar measures this every year in a study called Mind the Gap. It compares what funds earned with what the average dollar invested in them actually earned, given when people bought and sold. In the 10 years ending December 31, 2025, U.S. funds returned 9.9% a year, but investors earned 8.7% a year. According to Morningstar, that 1.2-point gap came from the timing and size of investors’ purchases and sales.
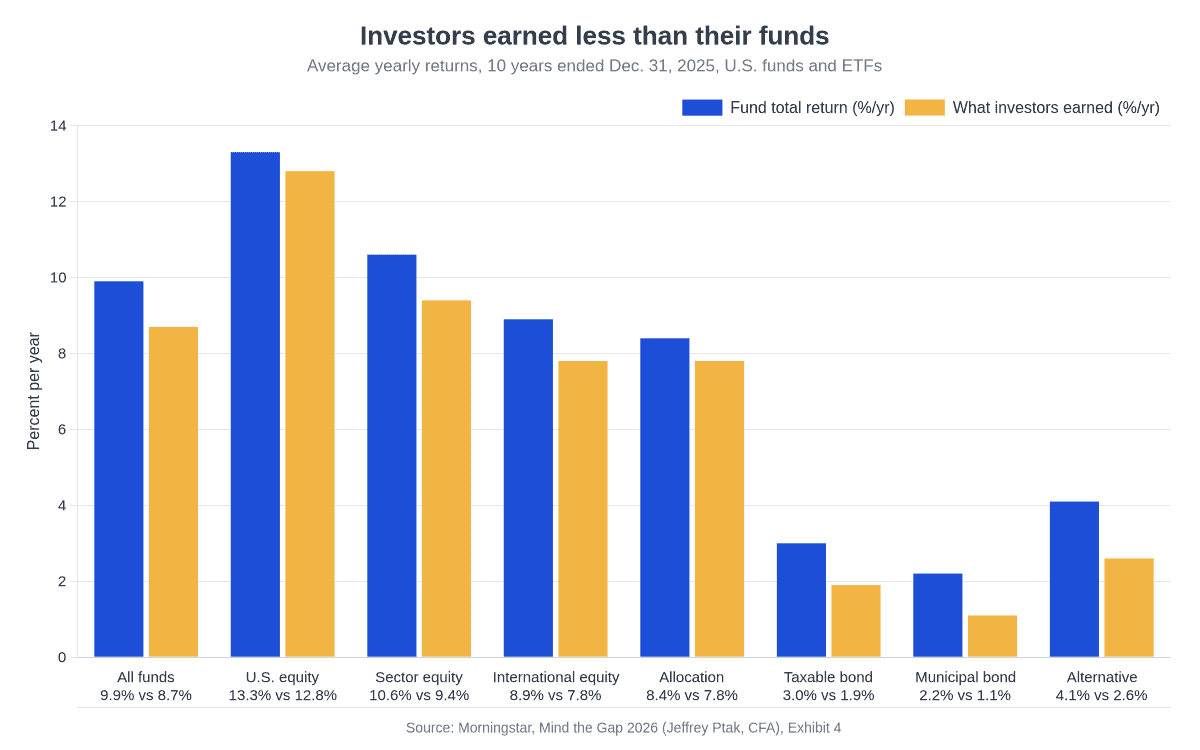
Notice the “Allocation” bar. That group includes balanced and target-date funds, which hold stocks and bonds in one place. Investors there lost 0.7 points a year to timing, less than the 1.2-point average across all funds. By comparison, sector funds, which focus on a single industry, saw a 1.2-point gap, and alternative funds were worst at 1.6 points.
Worked example: what a 1.2-point gap costs
For example, take $20,000 invested once (not added to each year) for 10 years. We’ll apply Morningstar’s two average rates as if they held steady every year. Real returns bounce around, so this is a simplified illustration.
- At 9.9% a year: $20,000 × 1.09910 ≈ $51,405
- At 8.7% a year: $20,000 × 1.08710 ≈ $46,060
So the difference is about $5,345 on one $20,000 deposit, lost to buying and selling at the wrong times. A mix you can stick with is worth more than a “perfect” one you abandon.
Confidence is part of this. In the Federal Reserve’s Survey of Household Economics and Decisionmaking for 2025, 47% of adults said they were mostly or very comfortable choosing and managing their investments. That leaves more than half who aren’t. If that’s you, a target-date fund or a simple three-fund mix with a once-a-year check can do most of the work.
The same survey also found that only 35% of adults who aren’t retired yet thought their retirement savings were on track. That share rose with age: 22% for ages 18 to 29, 35% for 30 to 44, 43% for 45 to 59 and 53% for those 60 and older. Your mix can’t fix a low savings rate, but it can make sure the money you do save has a fair chance to grow.

Five asset allocation myths, checked against the facts
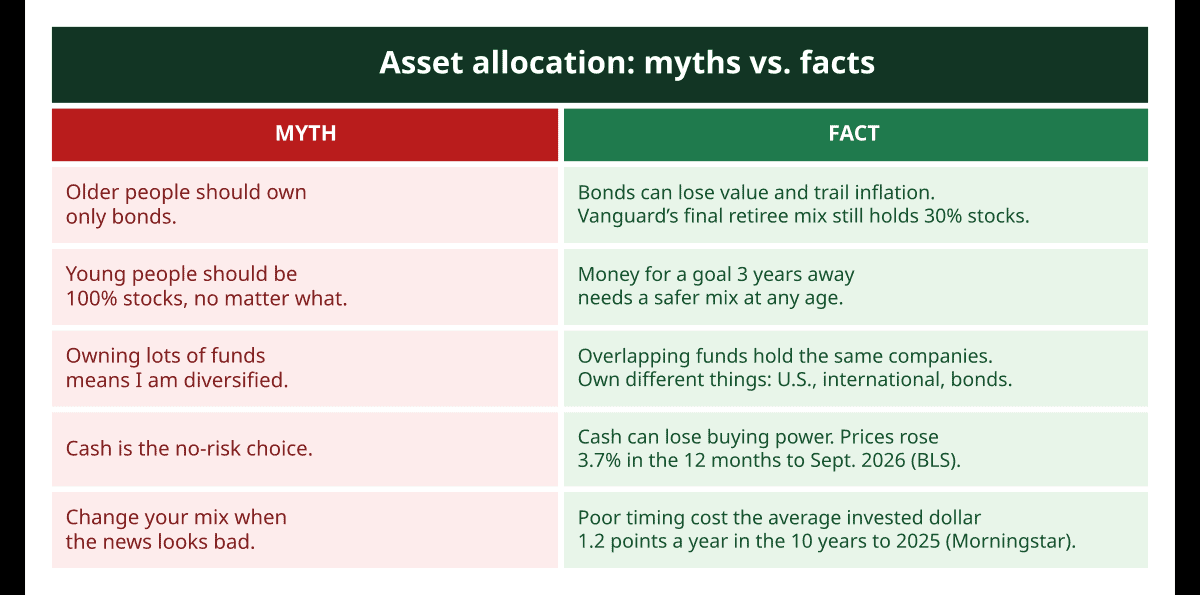
Myth 1: “Bonds are safe, so older people should own only bonds.”
Fact: Bonds can lose value when rates rise, and an all-bond portfolio can fall behind inflation over a long retirement. Even Vanguard’s most conservative target-date mix, reached years after retirement, still holds 30% stocks.
Myth 2: “Young people should be 100% in stocks, no matter what.”
Fact: Time horizon favors stocks for young investors’ retirement money, but money for a goal in three years shouldn’t follow that logic. A young investor who would panic-sell in a crash is also better off with a mix they can hold.
Myth 3: “Owning lots of funds means I’m diversified.”
Fact: Five U.S. large-company stock funds can own mostly the same companies. An S&P 500 fund and a total U.S. stock market fund overlap heavily, because the same big U.S. companies sit at the top of both. Holding both adds little. Instead, real diversification comes from owning different things: U.S. stocks, international stocks and bonds.
Myth 4: “Cash is the no-risk choice.”
Fact: Cash protects you from market drops, not from rising prices. For example, with prices up 3.7% in the 12 months through September 2026, a savings rate below that loses buying power. Cash is right for short-term goals and emergencies, but not for decades.
Myth 5: “I need to change my mix when the news looks bad.”
Fact: In Morningstar’s data, the average invested dollar earned about 1.2 points a year less than the funds did over the 10 years through 2025. Poorly timed buying and selling caused the gap. Change your mix when your life changes (a new goal, a new job, getting close to retirement), not when the headlines do.
Mistakes that quietly wreck a good mix
- Never picking a mix at all. Money that lands in a cash or stable value fund by accident can then sit there for years. Vanguard found only 2% of its plan participants held no stocks in 2025, but if you’re in that 2% by accident, it’s costly. Check where your contributions actually go.
- Doubling up on a target-date fund. Splitting money across three target-date funds with different years, or adding extra stock funds on top, scrambles the mix the fund was built to manage.
- Only looking at one account. Your 401(k) can look balanced while your IRA and old 401(k) are all stocks. Add them up.
- Too much in your employer’s stock. After all, your paycheck already depends on that company. NerdWallet suggests keeping any individual stocks to a small slice, around 5% to 10% of your portfolio.
- Forgetting to rebalance for years. As Fidelity’s example shows, a 60% stock mix can drift to 80% in a decade of strong markets.
- Rebalancing too often in a taxable account. Because every sale can mean a tax bill and possibly trading costs, once a year, with a band, is plenty for most people.
- Getting too conservative too early. A 50-year-old’s money may need to last 40 years or more. Dropping to mostly cash can leave the money short later.
Your seven-step asset allocation plan
- Set aside your emergency fund first. Keep three to six months of basic expenses in an FDIC-insured savings account, outside your investment mix.
- Sort your goals by date. Under 3 years: mostly cash. 3 to 10 years: a mix with plenty of bonds. Over 10 years: mostly stocks.
- Pick a starting stock percentage for your long-term money. For example, use 110 minus your age, or the stock share of a target-date fund for your retirement year.
- Adjust for you. Add 5 to 10 points if you have a pension, very secure income or a high tolerance for drops. Subtract 5 to 10 if your income is shaky or a past downturn made you want to sell.
- Choose simple, low-cost funds. Either one target-date fund, or three index funds: U.S. stocks, international stocks and U.S. bonds.
- Add up every account. Use the four-step method above to find your real mix, then steer new contributions to close any gaps.
- Put a yearly check on your calendar. Rebalance if any piece is more than about 5 points off. Also revisit the whole mix after big life changes.
Read this before you trust the numbers
- Fidelity’s historical returns are hypothetical index results from 1926 to 2025, before fees and taxes. Your results will differ.
- The “bad year” in Kwame’s example (stocks −35%, bonds +2%, cash +4%) is made up to show the math. It isn’t a forecast.
- Lena and Sam’s 28% stock gain is also an assumption. Real years vary widely.
- Owen’s target-date fund is assumed to hold about 90% stocks. So check your own fund’s fact sheet for the real figure.
- The Mind the Gap example applies 10-year average rates as if they repeated every year. Real returns bounce around.
- Treasury yields, inflation and tax thresholds are as of the dates given and will change.
Want a rough way to match a mix to your timeline? If so, here’s a decision checklist you can run in under a minute.
| If this describes the money… | A reasonable starting mix |
|---|---|
| Needed within 2 years (car, wedding, down payment) | All cash: high-yield savings, CDs or Treasury bills |
| Needed in 3 to 5 years | Conservative, roughly 20% stocks, 50% bonds, 30% cash (like Schwab’s sample) |
| Needed in about 10 years | Moderate, roughly 60% stocks, 35% bonds, 5% cash |
| Retirement 25+ years away, and you can sit through drops | About 85% to 90% stocks, or a target-date fund for your year |
| Retirement within 5 years | Often 40% to 60% stocks, depending on pension and other income |
| Already retired and drawing income | Often 30% to 50% stocks, with 1 to 2 years of spending in cash |
Of course, these are starting points drawn from the Schwab, Vanguard and Fidelity mixes above. They aren’t rules. The last row is a common planning approach, not an official figure, and your own mix depends on your income sources and comfort with risk.
What to remember
- Asset allocation is your split among stocks, bonds and cash. It sets most of your risk and growth.
- Time horizon matters most. Money you need soon shouldn’t ride the stock market.
- Age rules like 110 minus your age are starting points. But pensions, job security and your own nerves move the number.
- Major fund companies hold more stock than the old 100 rule: Vanguard’s target-date funds hold 90% stocks at 25 and 50% at 65.
- Your real mix is the total across every account, not one account at a time.
- Rebalance about once a year, or when something drifts more than about 5 points. When you can, do it in retirement accounts first to avoid taxes.
- In the 10 years through 2025, the average invested dollar lost 1.2 points a year to poor timing, per Morningstar. Pick a mix you can stick with.
Questions readers ask
What is a good asset allocation for my age?
A common starting point is 110 minus your age in stocks, with the rest in bonds. But big fund companies often hold more: Vanguard’s target-date funds hold 90% stocks at 25 and 50% at 65. Then adjust for your income, pension and how you handle market drops.
Is 60/40 still a good asset allocation?
A 60% stock, 40% bond mix is a classic middle-of-the-road choice. In Fidelity’s history from 1926 to 2025, its “Growth with Income” mix (60% stocks, 35% bonds, 5% short-term) averaged 8.49% a year, versus 10.29% for all stocks, with much smaller swings. It suits many people in their 50s and 60s, but younger savers with long horizons often hold more stock.
How often should I rebalance my asset allocation?
For most people, once a year is enough. In fact, FINRA says there’s no official timeline. A good rule is to check yearly and act only if a piece has drifted more than about 5 percentage points from its target.
Should my emergency fund count in my asset allocation?
Most people keep it separate. Your emergency fund is protection, not an investment, so it should stay in insured savings no matter what your stock and bond mix looks like.
Are target-date funds a good idea?
For many people, yes. They handle the mix, the diversification and the rebalancing in one fund. Check the fee, the stock share at your target date and whether it’s a “to” or “through” fund. Still, they aren’t guaranteed and can lose money.
Should I own international stocks?
Many target-date funds do. Vanguard’s, for example, hold roughly 40% of their stock money in an international fund. International stocks also add companies and economies your U.S. fund doesn’t own, which can smooth returns over time.
What should I do with my asset allocation during a market crash?
Usually, nothing drastic. If your mix still fits your timeline, a crash is a time to rebalance by buying the part that fell, not to sell. Instead, change your mix for life reasons, not headlines.
How do I find my 401(k)’s current asset allocation?
Log in to your plan’s website and look for “investments” or “asset allocation.” If you hold a target-date fund, open the fund’s fact sheet to see its stock and bond split. Then combine it with your other accounts.
Your first move
This week, find your real stock percentage. Log in to every investment account, write down each balance and its funds’ stock shares, and add them up the way Owen did. It takes about 30 minutes. Then, once you know your number, compare it to the decision checklist above. If you’re more than 10 points away from where you want to be, start steering new contributions toward the piece that’s light.
About this guide
Published by Daniel Brienza, founder and editor of Sensible Money Guide (B.S. in Business Administration, University of South Florida). This guide was researched and drafted with the help of AI tools, then fact-checked against the primary sources listed below before publishing. Daniel is not a licensed financial advisor; this guide is for general education.
Published October 26, 2026. Figures are current as of that date.
Sources
Government and official sources
- U.S. Securities and Exchange Commission, Investor.gov. Beginners’ Guide to Asset Allocation, Diversification, and Rebalancing. Accessed October 2026.
- U.S. Securities and Exchange Commission, Investor.gov. Target Date Funds – Investor Bulletin. March 25, 2025.
- FINRA. Asset Allocation and Diversification. Accessed October 2026.
- Federal Deposit Insurance Corporation. Understanding Deposit Insurance. Updated April 1, 2024.
- U.S. Bureau of Labor Statistics. Consumer Price Index – September 2026. October 14, 2026.
- U.S. Department of the Treasury. Daily Treasury Par Yield Curve Rates, October 2026. Accessed October 25, 2026.
- Board of Governors of the Federal Reserve System. Economic Well-Being of U.S. Households in 2025: Savings and Investments. May 2026.
- Board of Governors of the Federal Reserve System. Changes in U.S. Family Finances from 2022 to 2025: Evidence from the Survey of Consumer Finances. October 2026.
- Internal Revenue Service. Topic No. 409, Capital Gains and Losses. Updated September 24, 2026.
- Internal Revenue Service. Revenue Procedure 2025-32 (2026 inflation adjustments). October 2025.
- Internal Revenue Service. Individual Retirement Accounts Offer Benefits Now and in the Future. September 16, 2025.
- U.S. Securities and Exchange Commission, Investor.gov. Money Market Funds. Accessed October 2026.
Banks, investment firms and research
- Vanguard. How America Saves 2026. June 2026.
- Vanguard. Vanguard Target Retirement Series Specifications. Data as of December 31, 2025.
- Vanguard. TDF Glide Path. Accessed October 2026.
- Vanguard Chester Funds. Form N-CSR Annual Report, Vanguard Target Retirement Funds (SEC EDGAR). Fiscal year ended September 30, 2025.
- Fidelity Investments. Principles of Investing. Data through December 31, 2025.
- Fidelity Investments. Fidelity Fund Portfolios—Diversified. Accessed October 2026.
- Fidelity Investments. Rebalancing Is Key. Data through December 31, 2025.
- Schwab Center for Financial Research. Retirement Portfolio Assets: Allocation by Age. May 26, 2026.
- Charles Schwab. Rebalancing in Action. March 10, 2026.
- Morningstar, Jeffrey Ptak, CFA. Mind the Gap 2026. August 2026.
- Morningstar, Christine Benz. In Praise of Target-Date Funds. April 27, 2021.
- Morningstar. 15 Charts Explaining an Extreme Year for Investors. Accessed October 2026.
- Fidelity Investments. What Is Asset Allocation? (YouTube video) Accessed October 2026.
News and personal finance media
- Kiplinger, Coryanne Hicks. The Easiest Asset Allocation Rule. Updated March 12, 2026.
- NerdWallet. Investment Portfolio: What It Is and How to Build a Good One. Updated April 2, 2026.
- CNBC, Ilana Polyak. Age and Risk Tolerance Key to Mastering Asset Allocation. June 10, 2015.
- Yahoo Finance, Ethan Wolff-Mann. 57% of Boomers Who Manage Their Own Money Should Rebalance Their Portfolios: Fidelity. About December 2019.
- Ramsey Solutions. How to Choose the Right Mutual Funds. Updated August 20, 2025.
This article is for educational purposes only and isn’t financial advice. Consider talking with a qualified professional about your situation.


Asset Allocation by Age: How to Mix Stocks, Bonds and Cash

Debt Consolidation in 2026: Loans, Transfers and Pitfalls

How to Build Credit From Scratch: Your First-Year Plan

How Does a 401(k) Work? Matching, Taxes and 2026 Limits

How Much Do You Need for a House Down Payment?

How to Pay Off Credit Card Debt: Avalanche, Snowball and More

How to Make a Budget That Actually Works, Step by Step

How Much Emergency Savings Do You Need? Find Your Number

How Credit Scores Work: FICO Factors and Ways to Improve

You must be logged in to post a comment Login